5. Tutorial of Microsoft Excel:

(1) What is Microsoft Excel and its installation.
(2) How to create & save a file Microsoft Excel.
(3) How to make a password protected Microsoft Excel file.
(4) How to select Cells/ Text.
(5) How to font change.
(6) How to Font size change.
(7) How to Font color change.
(8) How to make a text bold (B), Italic (I), Underline (U).
(9) How to Merge cells.
(10) How to cut, copy & paste cells/ text.
(11) How to align content with Left, Right, Center align, Top, Middle or Bottom align.
(12) How to Draw Cell border.
(13) How to change cells background color.
(14) How to cells background color, font, border change with condition (Conditional Formatting).
(15) How to use Data Validation to input fixed text in cells.
(16) How to hide or unhide rows and columns.
(17) How to apply filter.
(18) How to Page setup.
(19) How to print page.
(20) How to mimic a watermark or place background image.
Formulas and Functions
(1) Use of Sum & AutoSum.
(2) Use of Average function.
(3) How to Divided two value.
(4) How to Multiply two value.
(5) How to use Count formula.
(6) How to use COUNTIFS formula.
(7) How to use MAX formula.
(8) How to use MIN formula.
(9) How to use RANK formula.
(10) How to use IF formula.
(11) How to use SUMIFS formula.
(12) How to use LOOKUP formula.
Graph
(1) How to make a Column Graph.
(2) How to make a Line Graph.
(3) How to make a Line Graph with two or more series.
(4) How to make a Pie Graph.
(5) How to make a Combo Graph with secondary axis.
(5) How to make a Combo Graph with secondary axis in excel.


Combo graph means two or more type graph at one graph or graph with secondary axis. secondary axis means graph based on another value rang in right axis. Following is the example of a two series line graph with secondary axis:
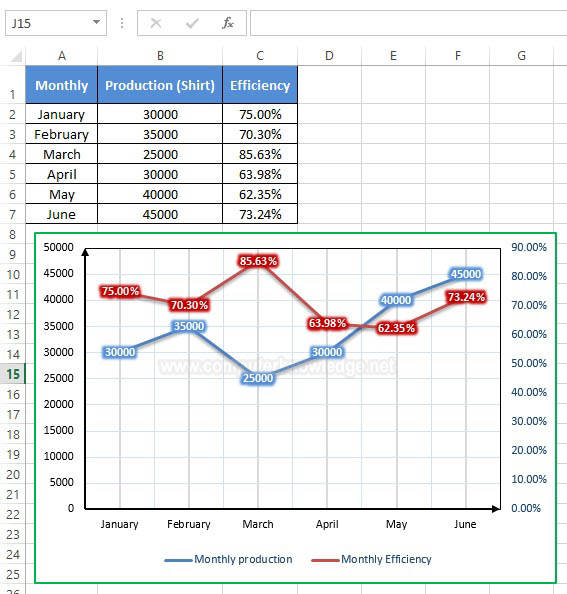
Excel Line graph


Following are the step by step procedure of How to make a two series line graph with secondary axis in excel:

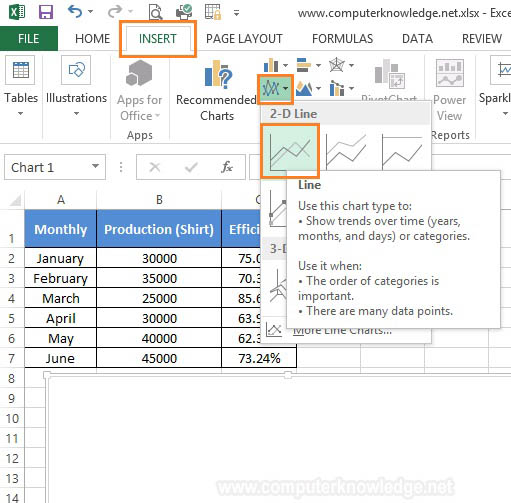
Step-1: Open excel file. Input your data. Click to a blank cell. Now click to Insert tab & click to Line.


SUMIFS

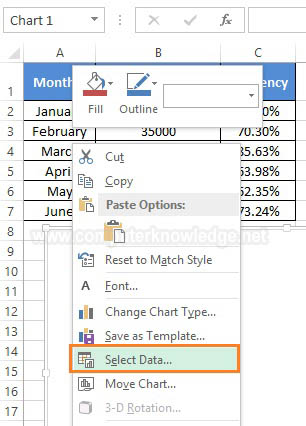
Step-2: Mouse right click to the blank graph. Click to the Select Data.


SUMIFS


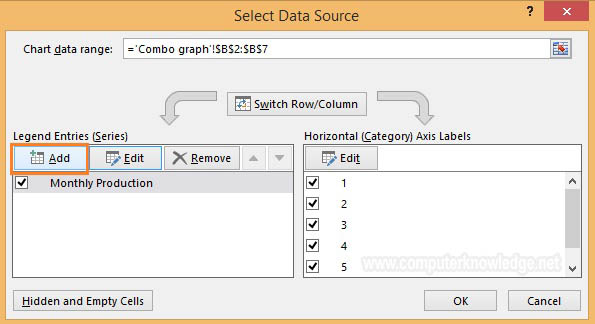
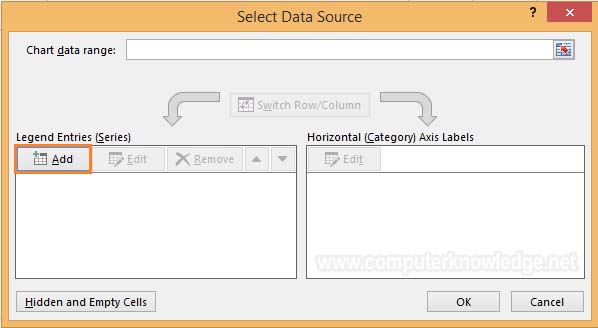
Step-3: From Legend Entries (Series) click to Add.
SUMIFS

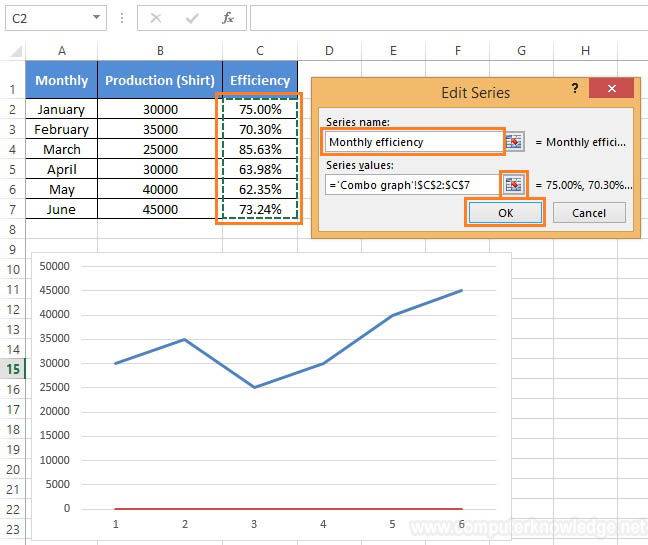
Step-4: Write the Series name. Select the Series Values. Than click OK.

SUMIFS

Step-5: Again click to Add.

SUMIFS

Step-6: Again write the Series name. Select the Series values. Than click OK.
SUMIFS

Step-7: From Horizontal (Category) Axis Labels click to Edit.

SUMIFS

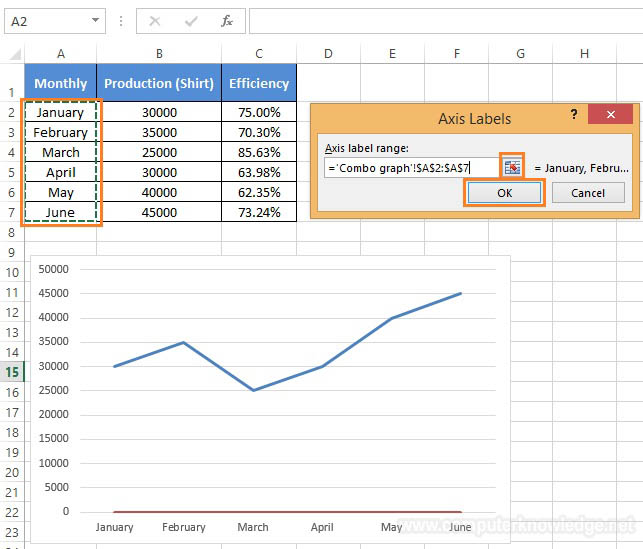
Step-8: Select the Axis label range. Than click OK.
SUMIFS

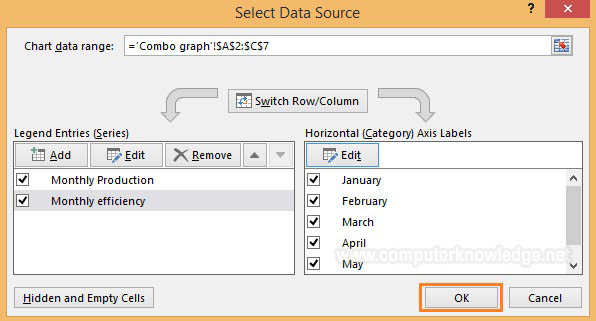
Step-9: Click to OK.

SUMIFS

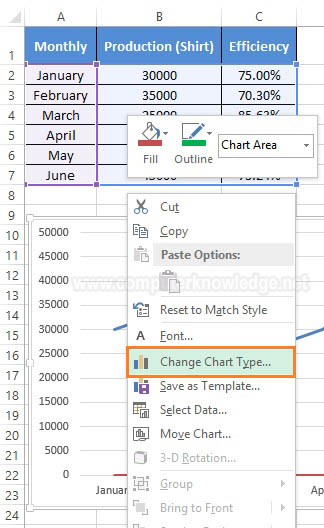
Step-10: Mouse right click on graph and click to Change Chart Type.
SUMIFS

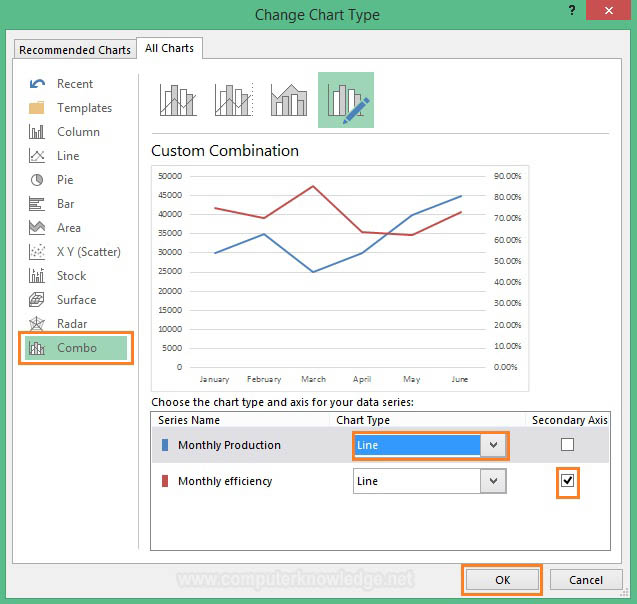
Step-11: Click to Combo. Select two Chart type as Line. Give the tick mark at secondary Axis at Monthly efficiency Chart. Click to OK.
SUMIFS

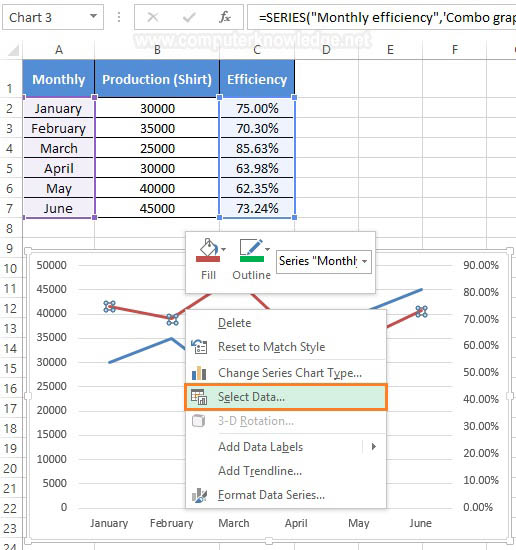
Step-12: Write click on a Line and select Add Data Labels to add data on top every Line.
SUMIFS


Video:

How to make a two series line combo graph with secondary axis in excel: