(4) How to make a Pie Graph in excel.
Following is the example of a Pie Graph:

Following are the step by step procedure of How to make a Pie Graph in excel:
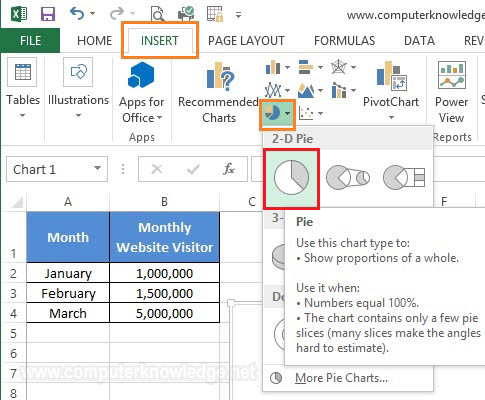
Step-1: Open excel file. Input your data. Click to a blank cell. Now click to Insert tab & click to Pie.
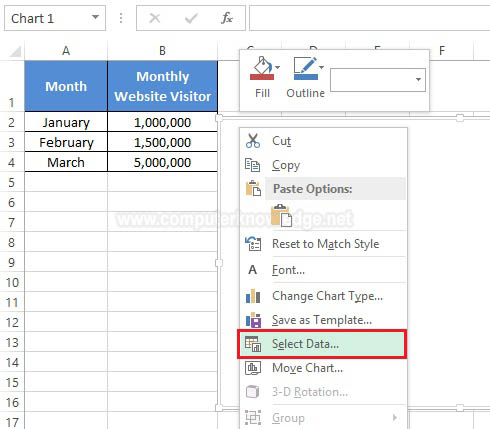
Step-2: Mouse right click to the blank graph. Click to the Select Data.
Step-3: From Legend Entries (Series) click to Add.

Step-4: Write the Series name. Select the Series Values. Than click OK.

Step-7: From Horizontal (Category) Axis Labels click to Edit.

Step-8: Select the Axis label range. Than click OK.
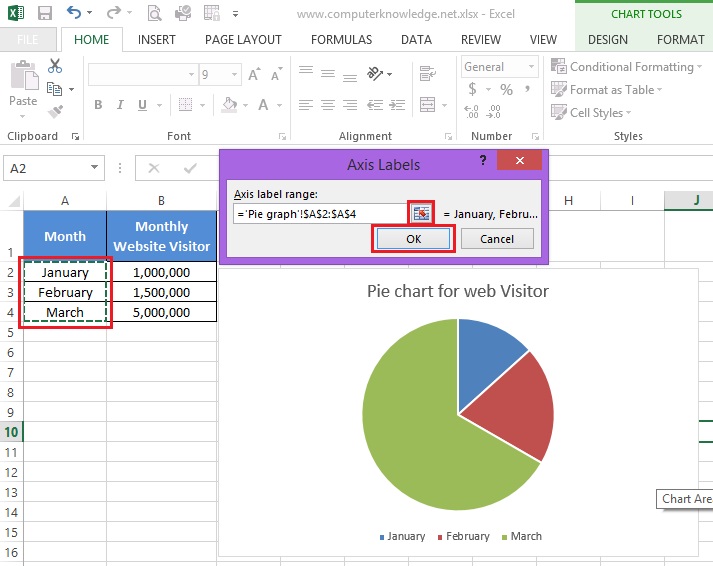
Step-9: Click to OK.

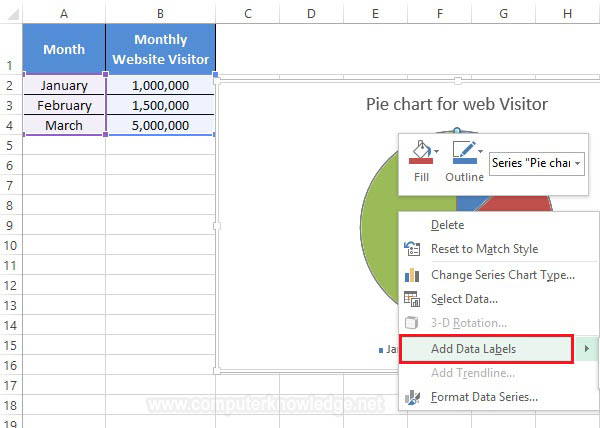
Step-10: Write click on graph and select Add Data Labels to add data.
Video:
How to make a Pie Graph in excel:
|