(1) How to make a Column Graph in excel.
Following is the example of a Column Graph:
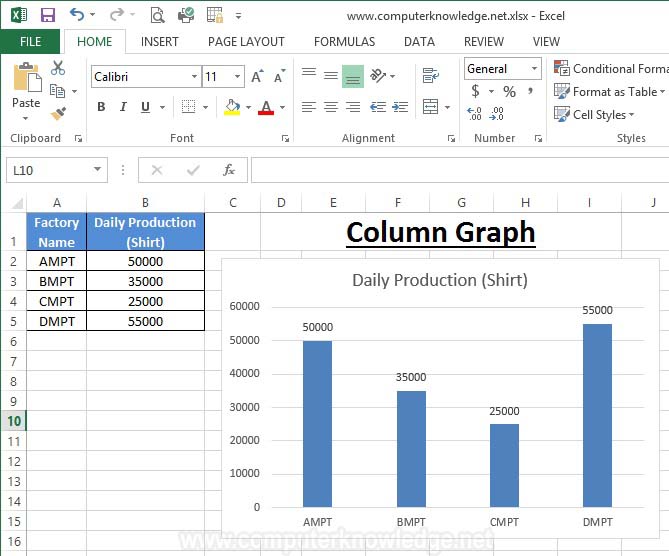
Following are the step by step procedure of How to make a Column Graph in excel:
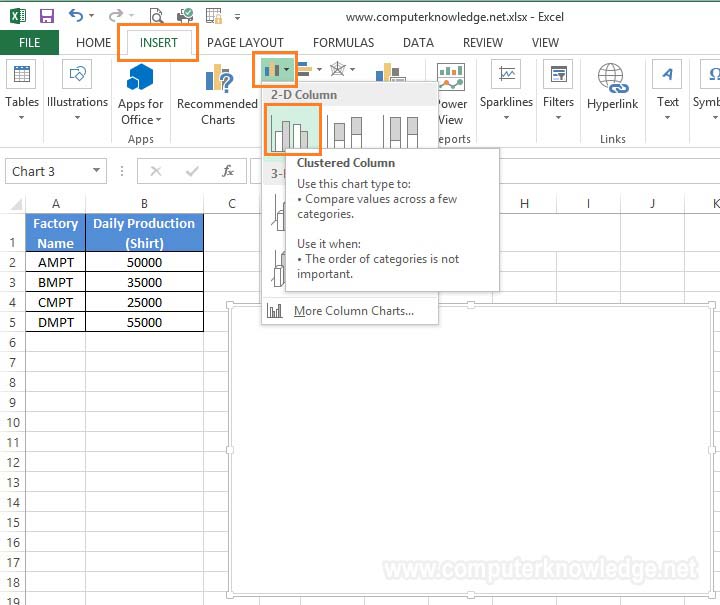
(i) Open excel file. Input your data. Click to a blank cell. Now click to Insert tab & click to Clustered Column.
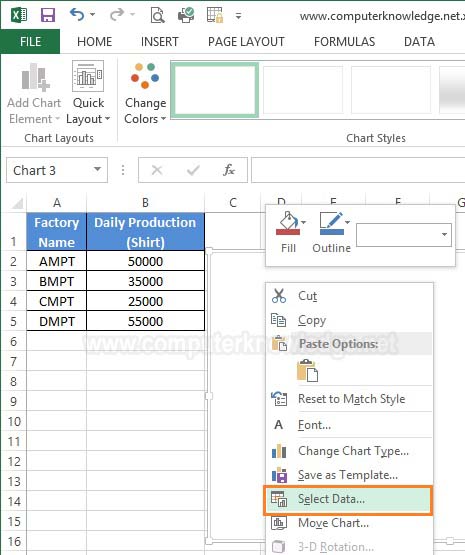
(ii) Mouse right click to the blank graph. Click to the Select Data.
(iii) From Legend Entries (Series) click to Add.
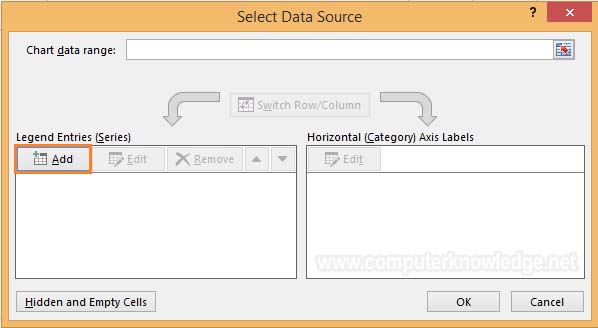
(iv) Write the Series name. Select the Series values. Than click OK.

(v) From Horizontal (Category) Axis Labels click to Edit.

(vi) Select the Axis label range. Than click OK.
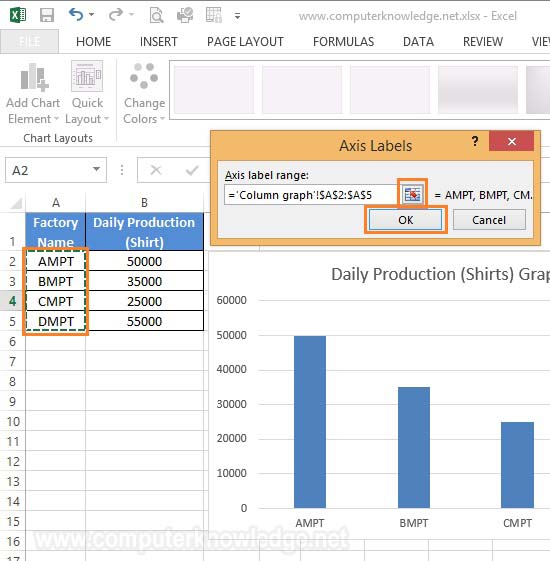
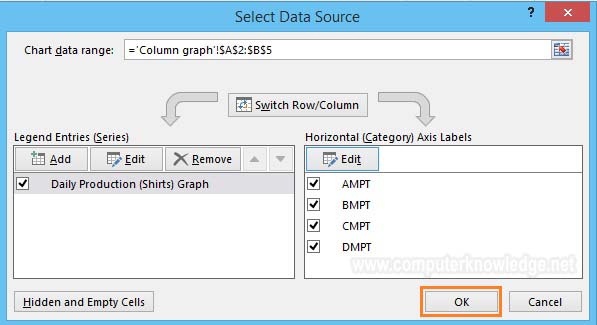
(vii) Click to OK.
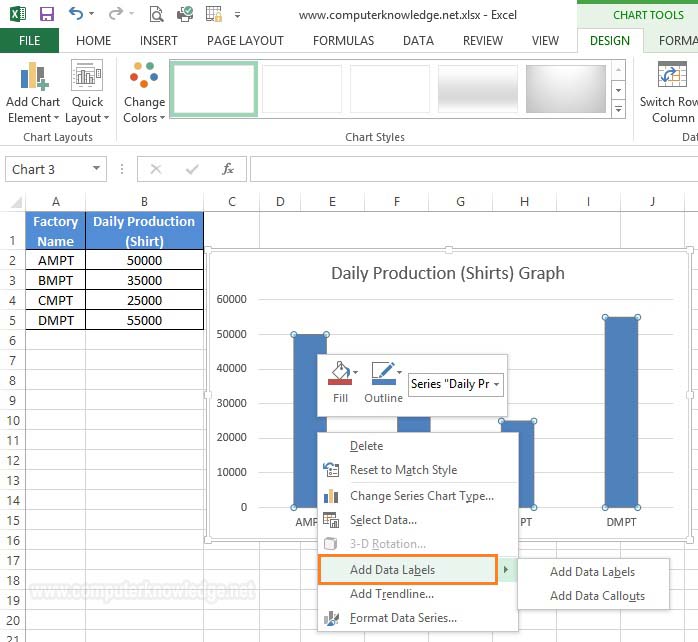
(viii) Write click on a column and select Add Data Labels to add data on top every column.
Video:
How to make a Column Graph in excel:
|